
InsightX
from hypotheses to a B2C product direction
- Role
- UX/UI designer
- Type
- Client project
- Tools



InsightX had a strong analytics engine and established B2B tools, but needed a direction for a standalone B2C product. The project moved from broad hypotheses to a focused product vision for advanced traders.
- Problem
- InsightX technology reached millions of users through B2B integrations, while the brand stayed in the background. The challenge was to define a standalone B2C product that users would engage with directly.
- Goal
- Define the target audience, value proposition and development direction for a B2C product.
- Outcome
- An analytics workspace concept for traders, based on identified needs and an analysis of existing solutions.
Starting point
The starting point was analytics technology used in a B2B model. The new product would make its capabilities available to individuals, but the target audience and ways of using the data needed to be clarified.
I worked iteratively, discussing hypotheses with the team twice a week. I combined learning about the domain with market research and analysis of potential user needs. I collaborated with a Senior Product Designer on the project.

Process
We explored different directions for InsightX, breaking them down into proposed features, user experiences and communication. Each hypothesis was examined against competitor analysis, business assumptions and conversations with users.
Hypothesis 01 Security crypto platform
View in Figma: Security hypothesisThe first hypothesis positioned InsightX as “Becoming #1 in Crypto Trust & Security”. It aligned with the team's messaging, but we needed to check whether there was still room in the market for this direction.
Competitor analysis showed that the security segment was already well served by CertiK/Skynet, Honeypot.is and similar tools. Entering this space would mean catching up with the leaders rather than creating a category of our own.
Takeaway: Strong competition from specialised platforms made it difficult to find a clear differentiator.
Automated smart contract audits
- Collaboration with external audit firms.
- A crawler collects data from APIs, blockchain explorers, security services and GitHub.
Trust Score
A proprietary Trust Score for each project, combining multiple dimensions of risk into one clear rating.
ETH 86% ★★★★☆
✓ Verified contract
✓ No honeypot
AI-generated reviews
Technical data translated into plain, understandable language.
Verified contract
High concentration risk
Security badges and certificates
A set of badges covering different aspects of trust.
Red flag warnings
- Technical signals turned into clear warnings.
- Regular alerts about serious threats.
- Example: high supply concentration + minting enabled.
Hypothesis 02 Newbie friendly
View in Figma: Newbie-friendly hypothesisThe second hypothesis came from the insight that a large part of the market consists of beginners making emotional decisions. The concept was a light, educational security platform that helps people recognise scam risks without the language of professional tools.
Takeaway: A beginner-focused direction did not match the business priority of reaching advanced traders.
Card-based interface
- Data presented as approachable cards instead of tables
- One card per project, with key information
- A quick overview without digging into details
- Less clutter, with essential information upfront
Appealing design
- A modern, colourful interface that appeals to younger users
- Gen Z energy: memes, animations and microinteractions
- Moving away from the “boring” look of financial apps
Interactive cards
- Save cards to favourites
- Interactive elements: expand details with one click
- Personalised alerts for followed projects
Example: “Your coin dropped by 20%”
or “Red flag detected”
Themes
- Let users personalise the app's appearance
- Light mode, dark mode and colourful themes
- Adapt the interface to visual preferences
From segments to a target audience
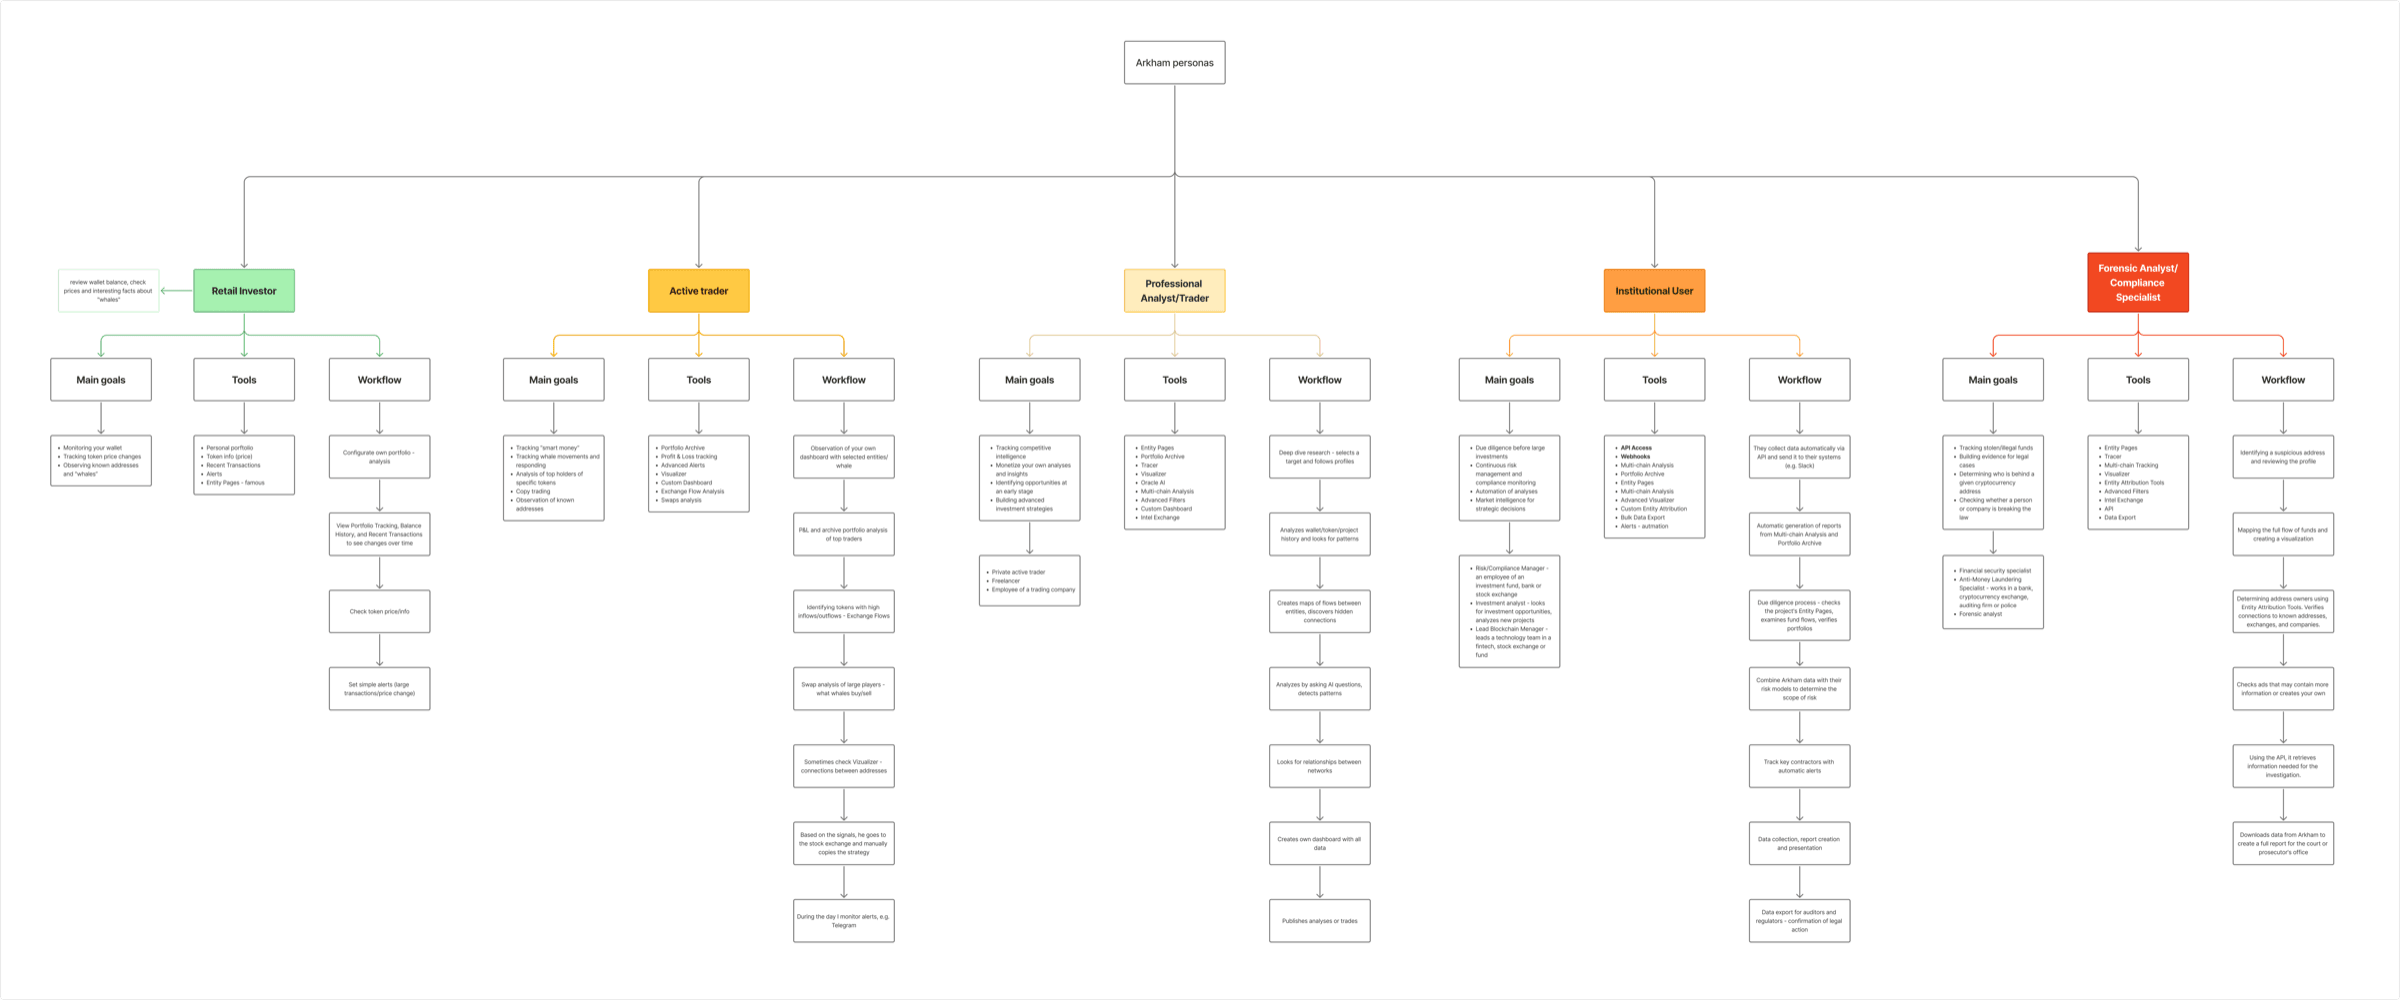
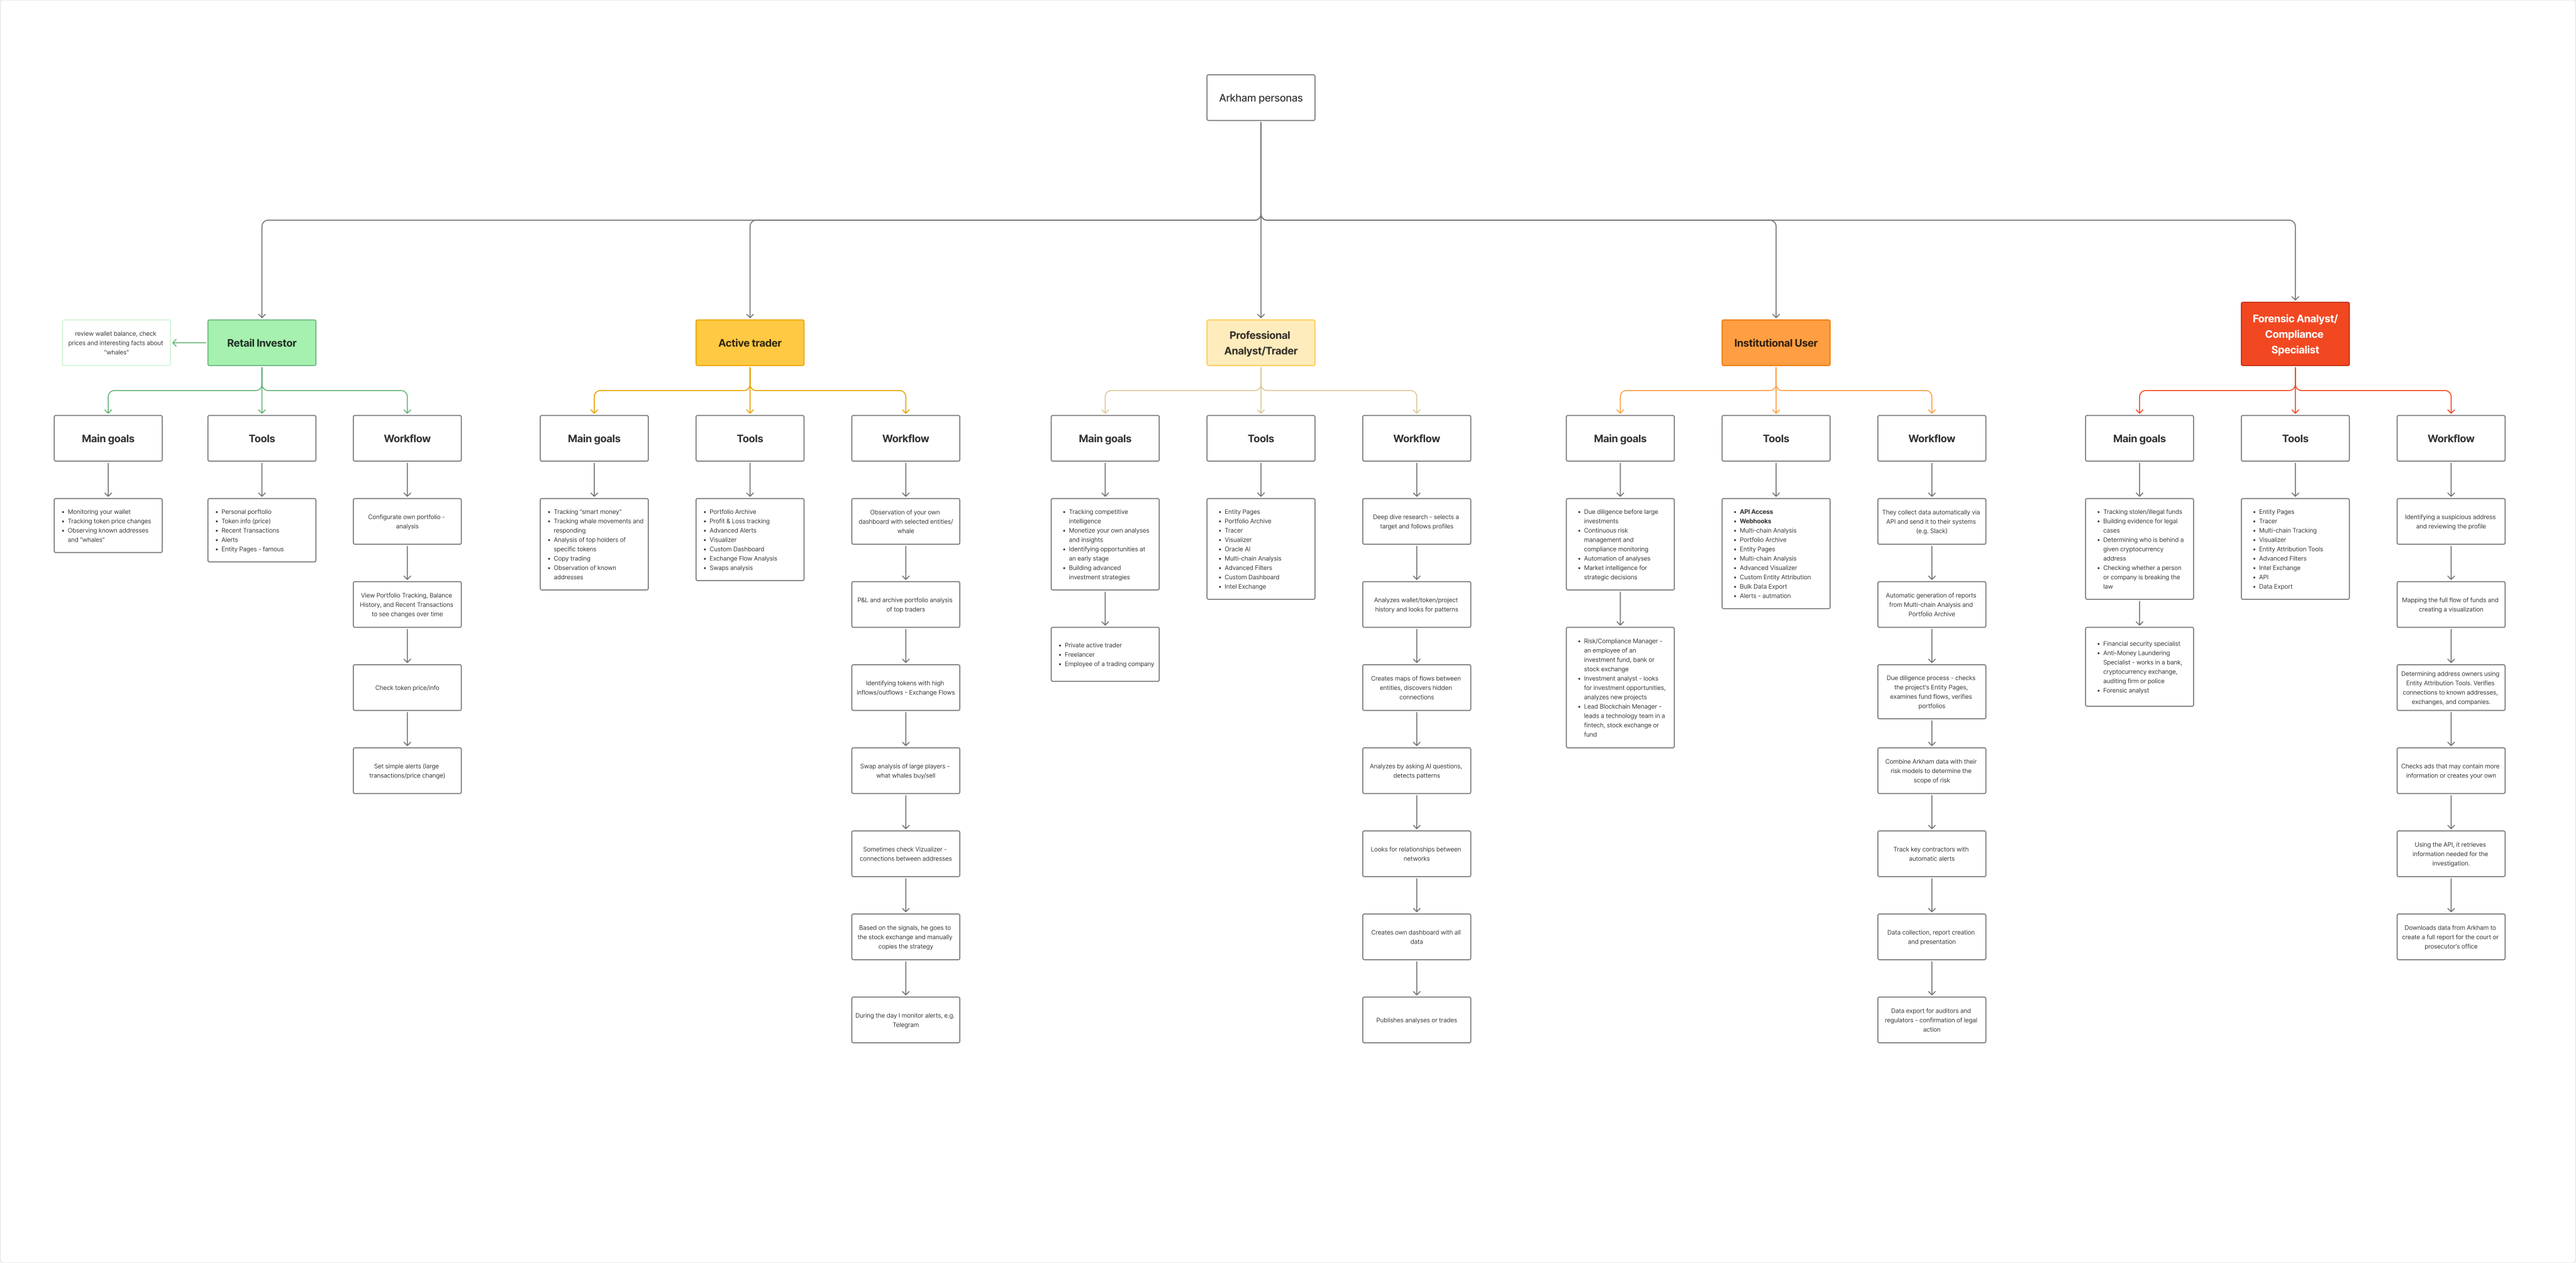
I analysed different ways people use crypto market information, from in-depth research and independent trading to reacting quickly to signals. The profiles differed in the depth of analysis, tools used and time spent making decisions.
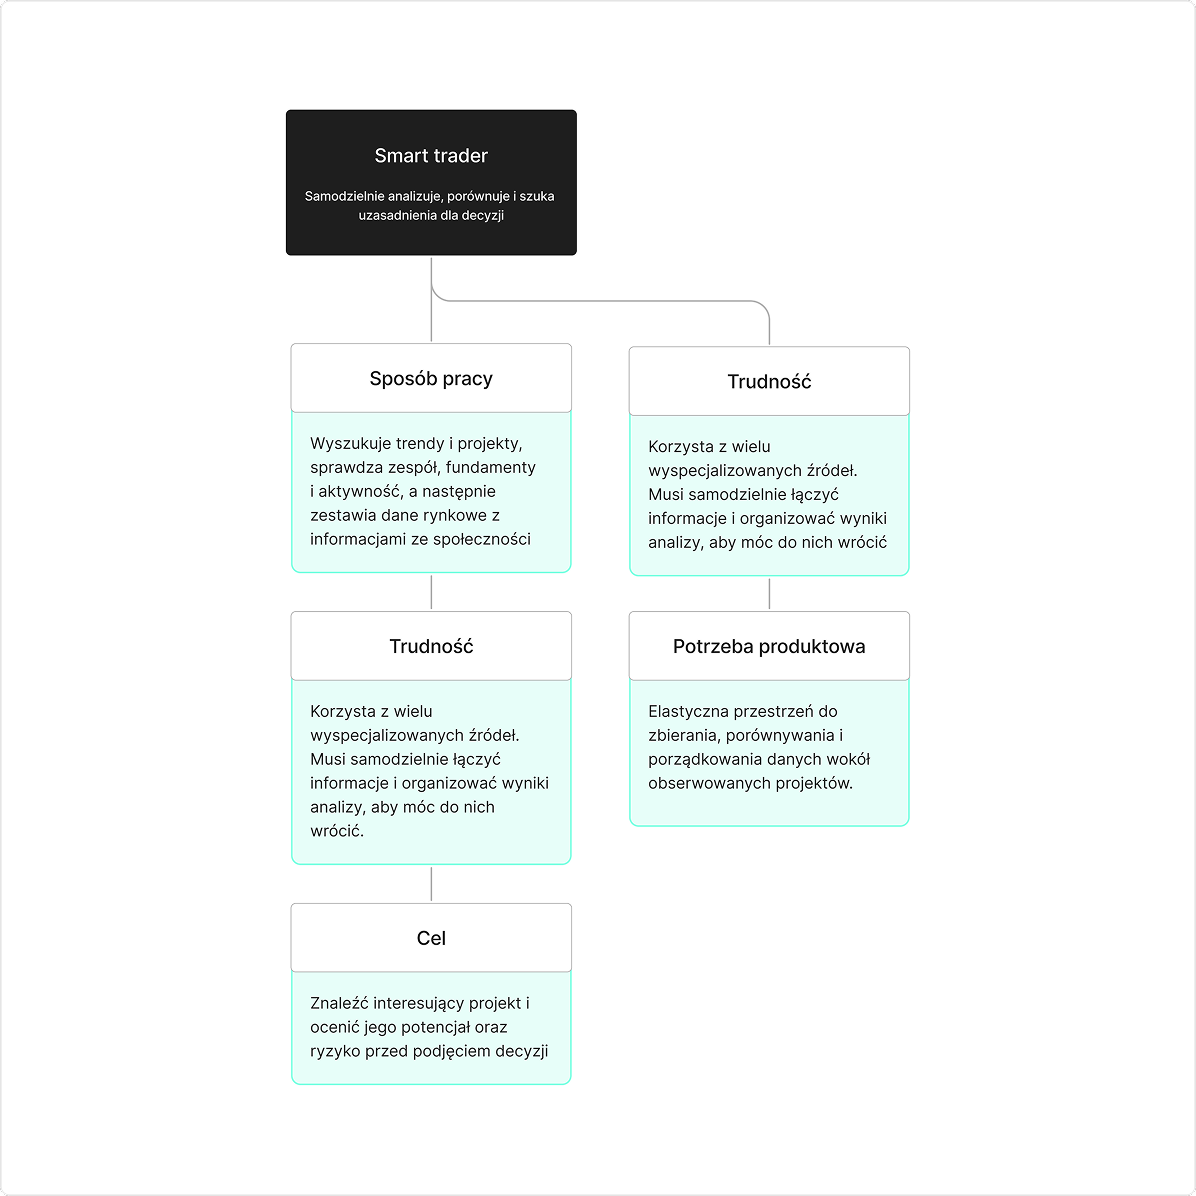
I focused the next stage on the Smart Trader profile: someone who combines data from multiple sources to assess projects and investment opportunities independently.
View in Figma: Full persona and JTBD map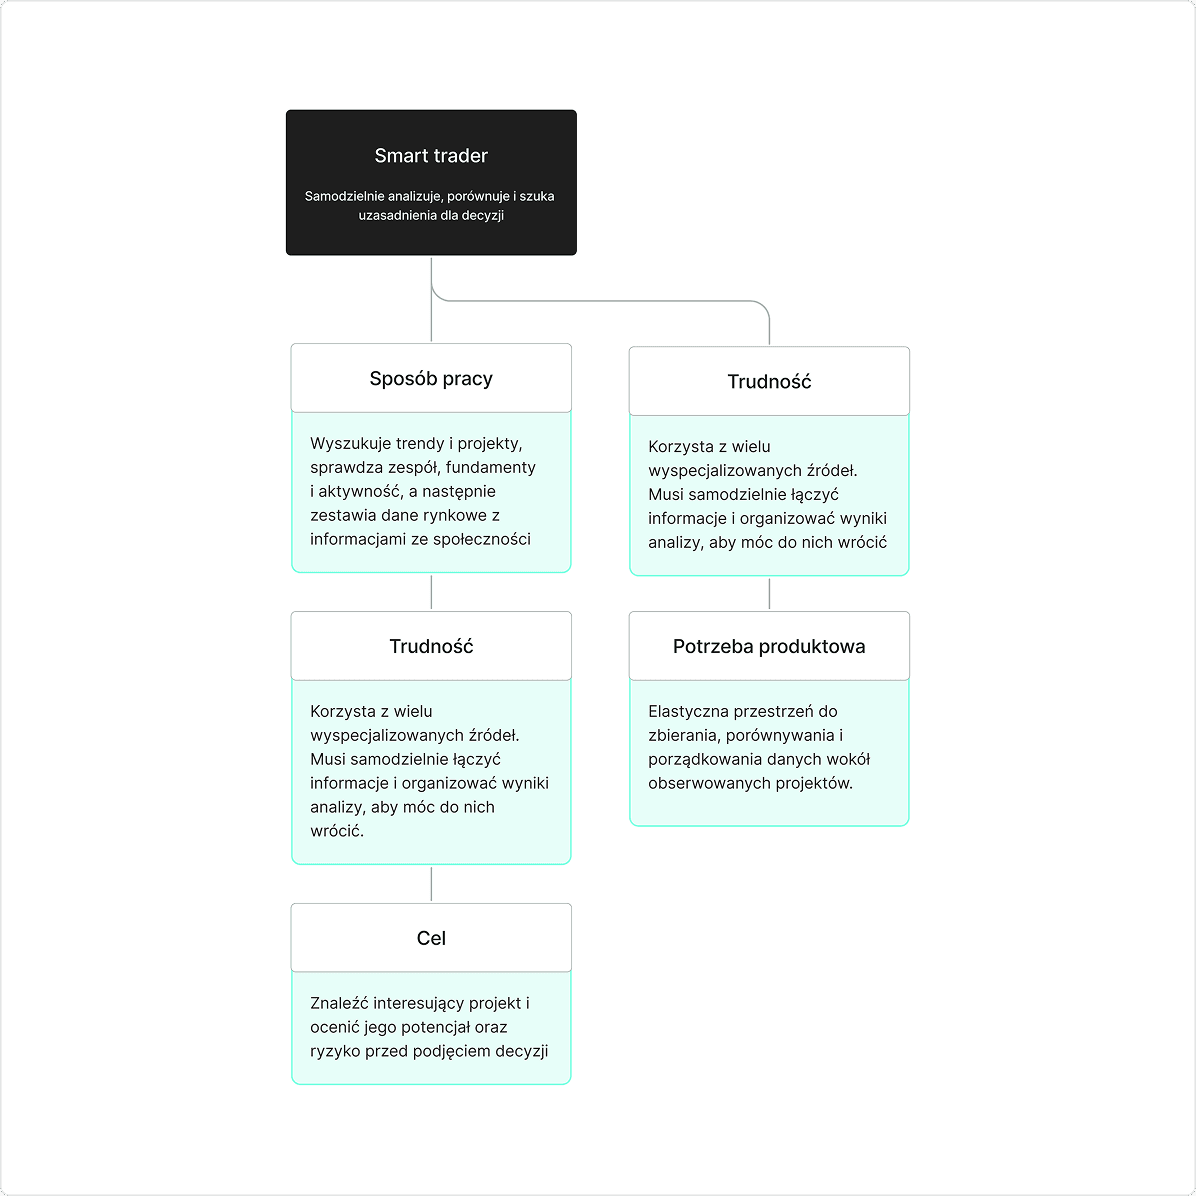
Analysing tools and refining the direction
I examined tools such as Arkham and Dune, comparing their capabilities with Smart Trader needs. I looked at data presentation, tool flexibility and the knowledge required to use them, with a particular focus on Arkham.
We discussed the findings with the CEO, bringing user perspectives together with the technology's capabilities and business assumptions. Together, we refined the direction into a configurable analytics workspace that helps users collect and work with information in one place.
InfoFi - your own analytics workspace
The final direction was a workspace for traders, combining market data, project information and the context needed to interpret it. Users would be able to organise it around their own strategy and the projects they follow.
- Configurable boards
- Choose and arrange information around your own analysis process, rather than relying solely on a fixed dashboard.
- Data and context in one place
- Bring information from different sources together to reduce switching between tools and make comparing projects easier.
- AI support
- Ask questions in natural language to make data easier to work with, without having to write SQL queries.
Results and reflections
The project concluded at the concept and product foundations stage. We delivered a persona and JTBD map, competitor analysis covering barriers to entry, data coverage and missing scenarios, and product gap maps identifying an opportunity for a new product.
The next step would be to work with traders to understand which parts of the workspace matter most and should be included in the first product version.